
IS02:Why Does Norway Have 240,000 Islands When South Korea Has Only 3,000?
A short investigation into a number that says more about its mappers than its coastline.

C.Y. Lu | Island Vantage | IS02
I once met a Norwegian engineer at a dinner who, when asked what he did on weekends, said, with the calm of a man explaining tax filing: “I tag skerries.” A skerry is a small rocky island, mostly granite, mostly cold. He had tagged, by his own count, somewhere over a hundred of them. He had GPS waypoints for each. He had a list. There was a coffee group, he said, who did this together.
I assumed at first he was joking. He was not. He was, it turned out, one of perhaps ten thousand Norwegians who spend weekends recording small rocky outcrops into the OpenStreetMap database. There are clubs. There are guides. There is a recommended kayak.
Pull the OSM headcount by country and Norway leads by an embarrassing margin: 82,993 islands tagged. South Korea, despite a famously fractal coastline and over three thousand documented islands in its own government registries, returns just 612 in OpenStreetMap. The two countries have similar maritime climates, similar sub-glacial geomorphology, similar populations of small rocky outcrops. The gap between them is 135×.
A hundred and thirty-five times. Not a hundred and thirty-five percent. A hundred and thirty-five times.
Geology cannot account for this. Korea has plenty of islands; the Korean Hydrographic and Oceanographic Agency counts more than three thousand of its own, and that number is itself conservative. So if both countries genuinely have similar quantities of small rocky things sticking out of the sea, what is the database measuring?
Plotting the top fifteen countries by OpenStreetMap island count gives the picture below. Norway sits comfortably alone at the top — the rose bar — followed at a respectful distance by Sweden, Canada, Finland, Greenland. South Korea, in peach, is mid-pack and looks unremarkable.
The pattern in this chart is not geological. It is cultural. The countries at the top are countries with active OpenStreetMap communities, weekend mapping clubs, a Wikipedia editor mentality applied to skerries.
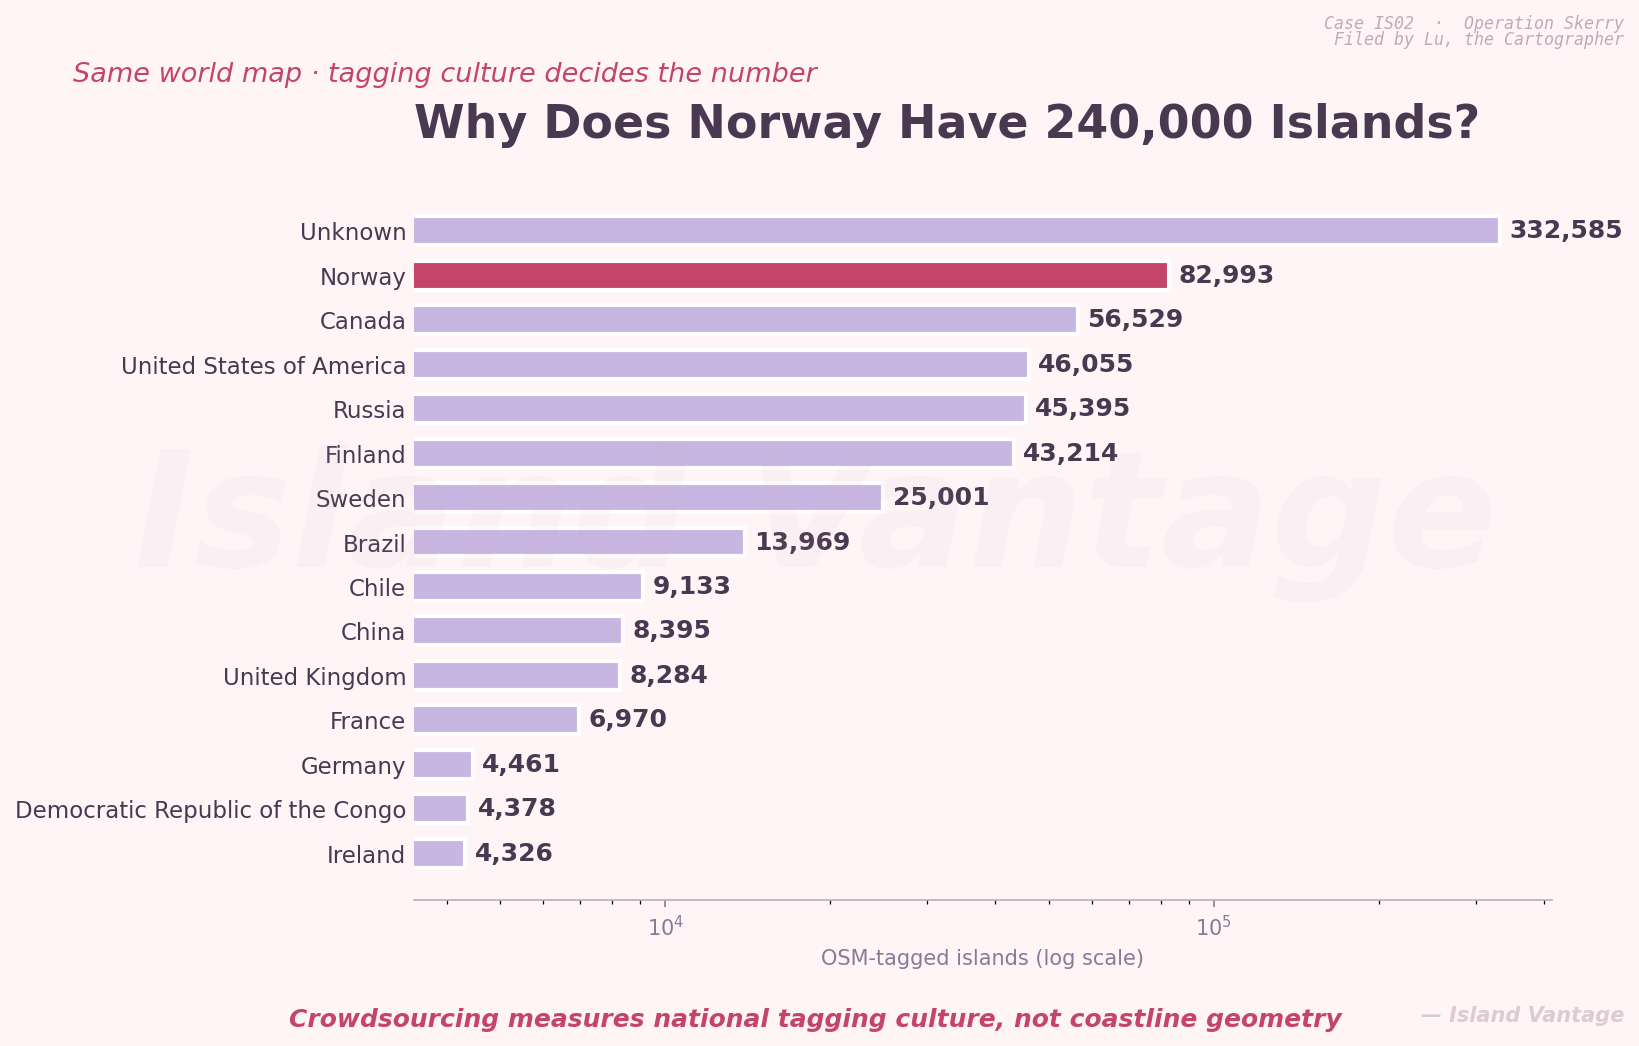
Figure 1 — Top fifteen countries by OSM-tagged islands. Norway leads by a culturally absurd margin; South Korea sits in the middle of the pack despite a coastline of similar complexity.
Norway has roughly 5.5 million people. South Korea has 51 million. By population, Korea should produce nine times the OSM contributions, not 1/80th. The ratio has to come from somewhere else.
It comes from a public-good production problem. Tagging an island into OpenStreetMap is unpaid, unrecognised, and has no immediate consumer. It is an act of pure civic-data citizenship. In Norway, that act has cultural cover: outdoor recreation, mapping clubs, a national pride in the seascape. In Korea, where the same energy goes into apartment-block-level Naver Map editing for commercial restaurants, the rocks get ignored. The economy of attention is unequal.
There is also a translation cost. The Norwegian word “skjær” — skerry — has its own OSM tag because Norwegian mappers built the schema. Korean has equivalent words (암초, 섬), but the OSM contributors don’t use them at scale because the contributors aren’t there. The vocabulary is the symptom, not the cause.
A bar chart can deliver the ratio. It cannot deliver the geography. To see what 135× looks like in space, plot every Norwegian OSM island on a map of Norway, then every Korean OSM island on a map of South Korea. Two countries with similar coastlines, two completely different visual densities.
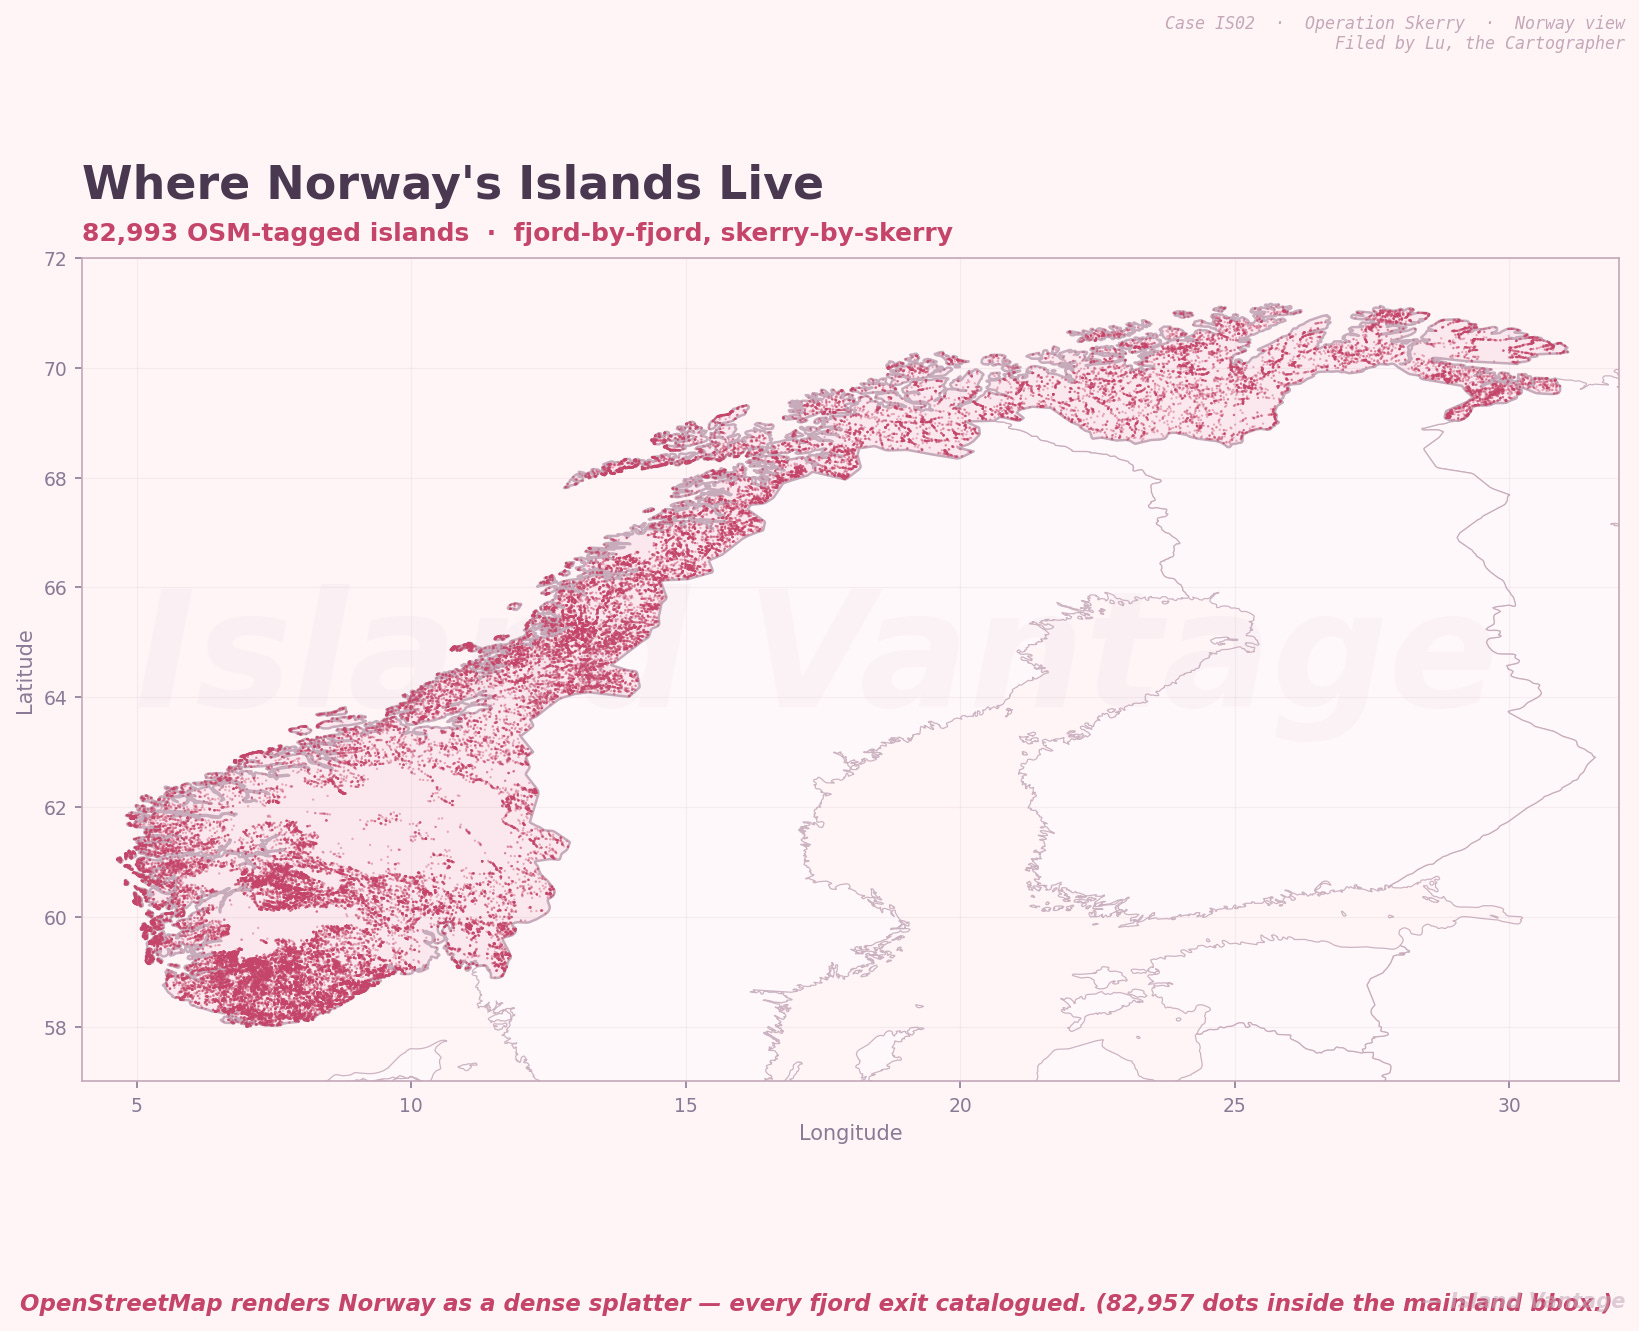
Figure 2 — Norway’s 82,993 OSM-tagged islands rendered as dots. The fjord coast becomes a continuous splatter; almost every offshore rock has been entered into the database by somebody, somewhere.
The Korean coastline is, by any geometric measure, more fractured per kilometre than the Norwegian one. The Korean Hydrographic Agency catalogues over three thousand islands. OpenStreetMap captures 612. The same coast looks, on the same database, almost empty.
The dots are not the islands. The dots are the islands that someone bothered to tag. Korea’s skerries are still there, indifferent to whether anyone has noticed.
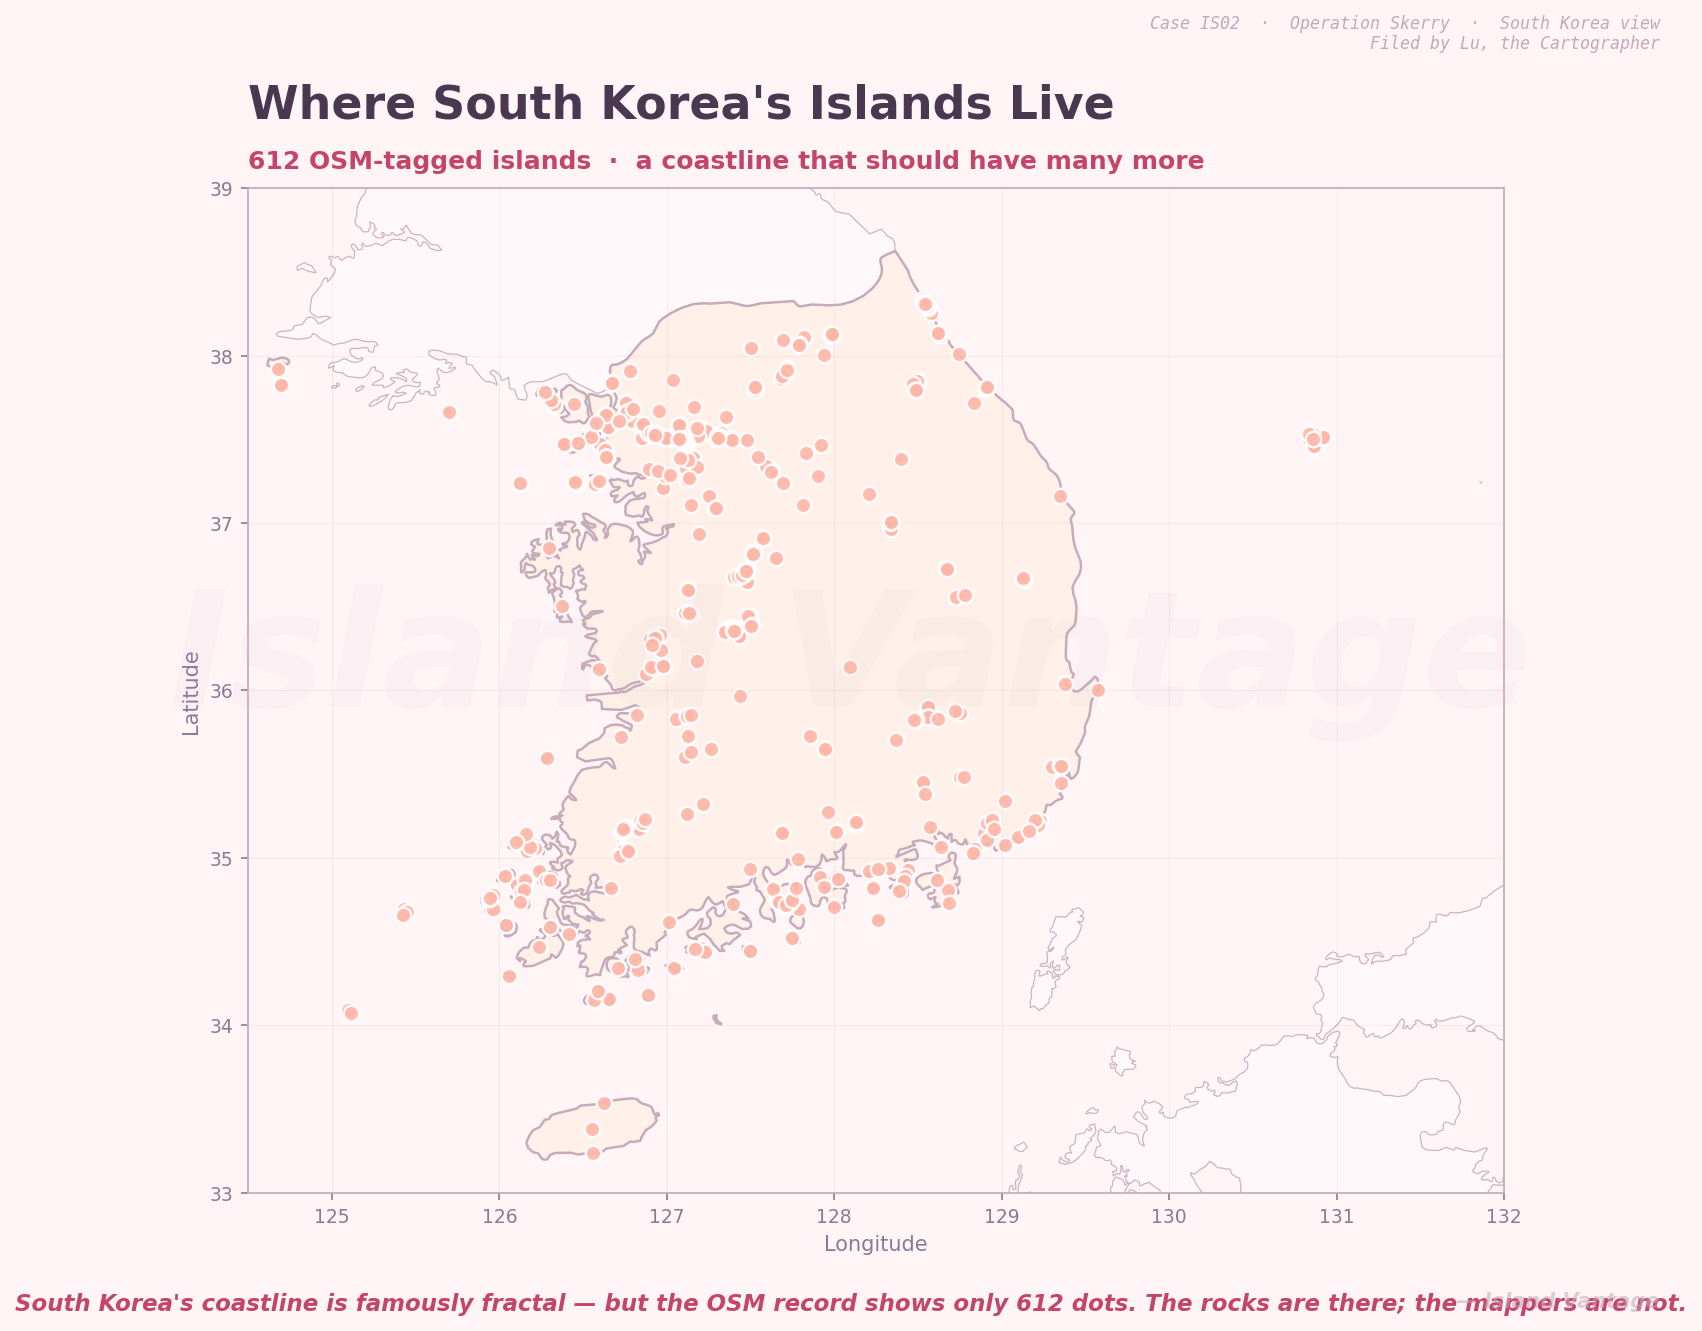
Figure 3 — South Korea’s 612 OSM-tagged islands rendered at the same conceptual scale. The coastline is dense with rocks; the database is not.
The seductive reading of these charts is that Norway has more islands than Korea. The charts do not say that. They say: Norway has more island-mappers than Korea. The islands are evenly distributed; the mappers are not.
This is the same statistical illusion that drives police-stop data, restaurant-review data, and Wikipedia’s gender gap. The metric measures the measurer. We treat crowdsourced data as if it were the world; what it actually shows us is which corners of the world somebody loves enough to tag.
A skerry off the coast of Bergen exists. A skerry off the coast of Tongyeong also exists. The difference is that the first one has a Wikipedia entry, a GPS tag, and a man with a kayak who keeps an eye on it. The second one is just there, indifferent to whether anyone has noticed.
— C.Y. Lu · Island Vantage · IS02