

C.Y. Lu | Island Vantage | Nov.1,2026

On October 14, 2026, ASML reported third-quarter results: revenue of EUR 11.66 billion (USD 13.2 billion), up 55% year over year and 25% quarter over quarter; operating income of EUR 5.17 billion (USD 5.8 billion), an operating margin of 44.4%. The company also said that the capacity it has planned for 2027 and 2028 still will not be enough to meet customer demand. When a company says it “can’t sell enough,” there are usually two readings: demand is genuinely strong, or it is laying the ground for the next price increase. The financial statements offer evidence that is more specific than either story.
First, who is this company? ASML, originally ASM Lithography, was founded in 1984 in Veldhoven, the Netherlands, as a joint venture between ASM International and Philips, and listed in Amsterdam and on Nasdaq in 1995. It makes lithography equipment for chipmaking. It has no controlling shareholder: according to public filings disclosed by the company as of February 18, 2026, the holders above 5% are BlackRock (6.83%) and Capital Research and Management (5.09%). In 2025 it generated revenue of EUR 32.67 billion (USD 36.9 billion) and net income of EUR 9.61 billion (USD 10.9 billion), with more than 44,000 employees (FTE). At a mid-October closing price of EUR 1,464.2 and roughly 385 million shares, its market capitalization is about EUR 564 billion (USD 638 billion; my own estimate, not a company-reported figure).
So here is the puzzle: why is a company with EUR 32.7 billion in annual revenue worth EUR 564 billion, 17 times its sales? Because market value does not buy last year’s revenue; it buys future cash flow. Three numbers help unpack it (own calculations). On 2025 net income, the price-to-earnings ratio is about 59x. On 3Q26 net income of EUR 4.96 billion annualized (about EUR 19.8 billion, simple arithmetic and not a forecast), it is about 28x. Against the midpoint of the company’s 2026 revenue guidance, EUR 44.5 billion, the market value is about 12.7 times revenue. In other words, the price reflects an expectation of how much longer this queue of orders will last, and what that expectation is worth is exactly the question this earnings report helps answer.
1. Of every extra euro sold, two-thirds becomes operating income
Start with leverage. Revenue rose from EUR 7.52 billion (USD 8.5 billion) in the year-ago quarter to EUR 11.66 billion (USD 13.2 billion), an increase of EUR 4.15 billion (USD 4.7 billion). Operating income rose from EUR 2.47 billion (USD 2.8 billion) to EUR 5.17 billion (USD 5.8 billion), an increase of EUR 2.71 billion (USD 3.1 billion). The incremental operating margin is about 65% (own calculation): of every extra EUR 100 of sales, EUR 65 landed in operating income.
This is not magic; it is fixed costs being spread thinner. Gross margin rose from 51.6% to 57.5%. R&D expense of EUR 1.17 billion (USD 1.3 billion) was only 6% higher than a year ago, and SG&A of EUR 0.35 billion (USD 0.4 billion) was 17% higher, both far below revenue growth of 55%. Net income of EUR 4.96 billion (USD 5.6 billion) was 2.3 times the year-ago EUR 2.12 billion (USD 2.4 billion); basic EPS was EUR 12.95 versus EUR 5.49.
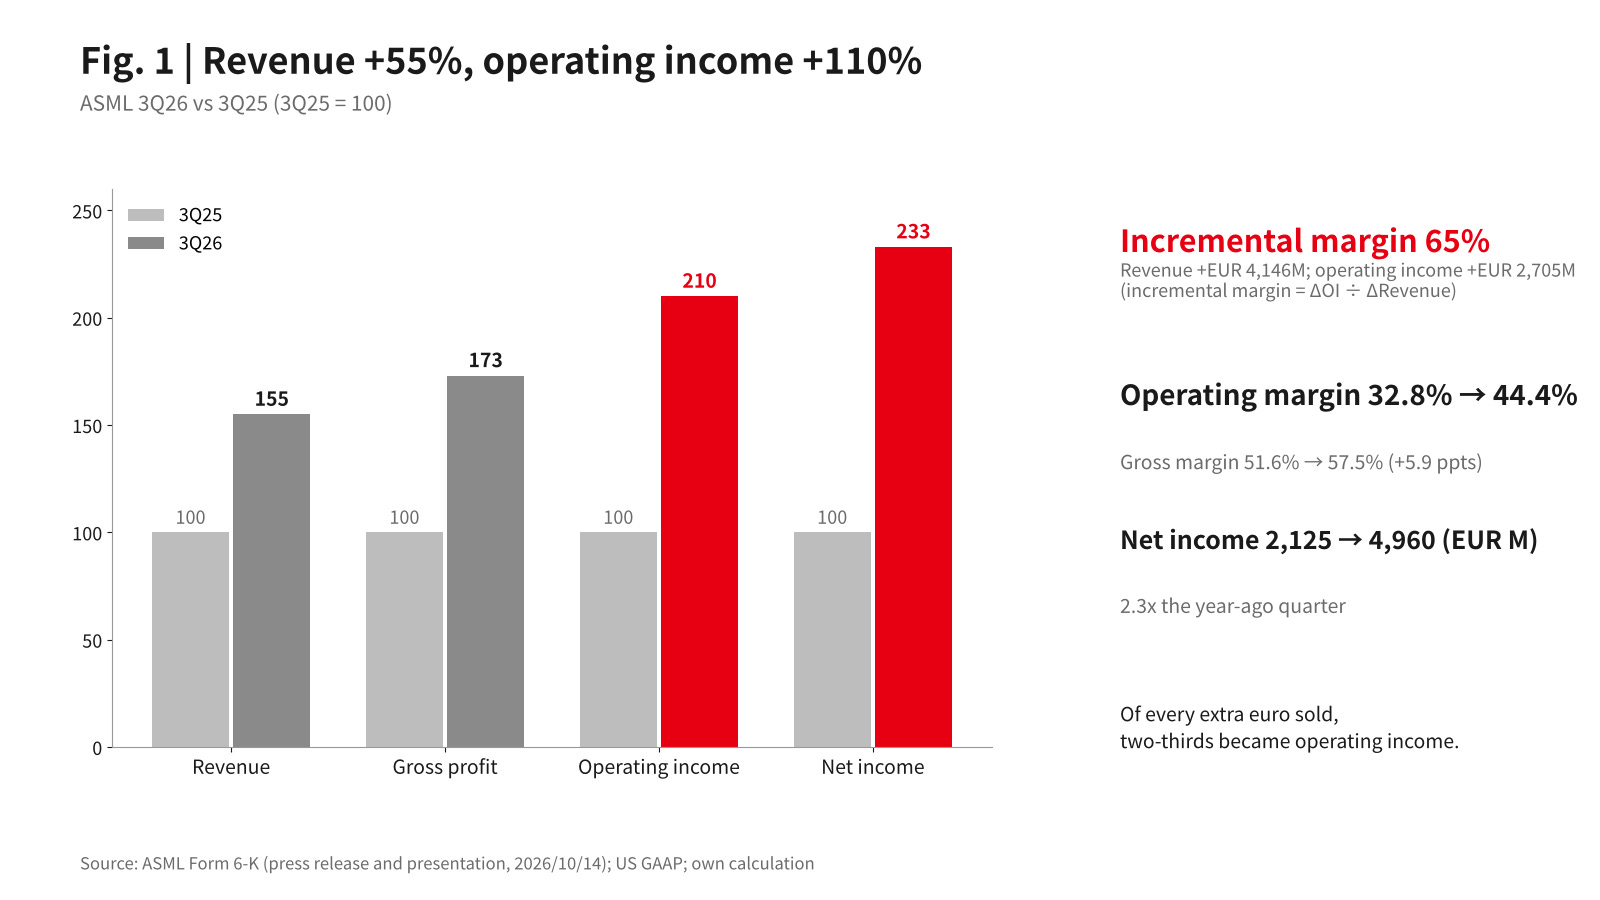
Fig. 1 | Revenue +55%, operating income +110%. How to read: indexed to 3Q25 = 100, grey is 3Q25 and red is 3Q26; across revenue, gross profit, operating income and net income, the further right, the more the growth is magnified. Source: ASML Form 6-K (2026/10/14); own calculation.
Where each EUR 100 of revenue goes has changed too: cost of sales fell from EUR 48.4 to EUR 42.5, R&D from EUR 14.8 to EUR 10.1, and operating income rose from EUR 32.8 to EUR 44.4. Economists call this operating leverage: a company with a high share of fixed costs sees profit magnified when revenue rises, and by the same multiple when revenue falls.
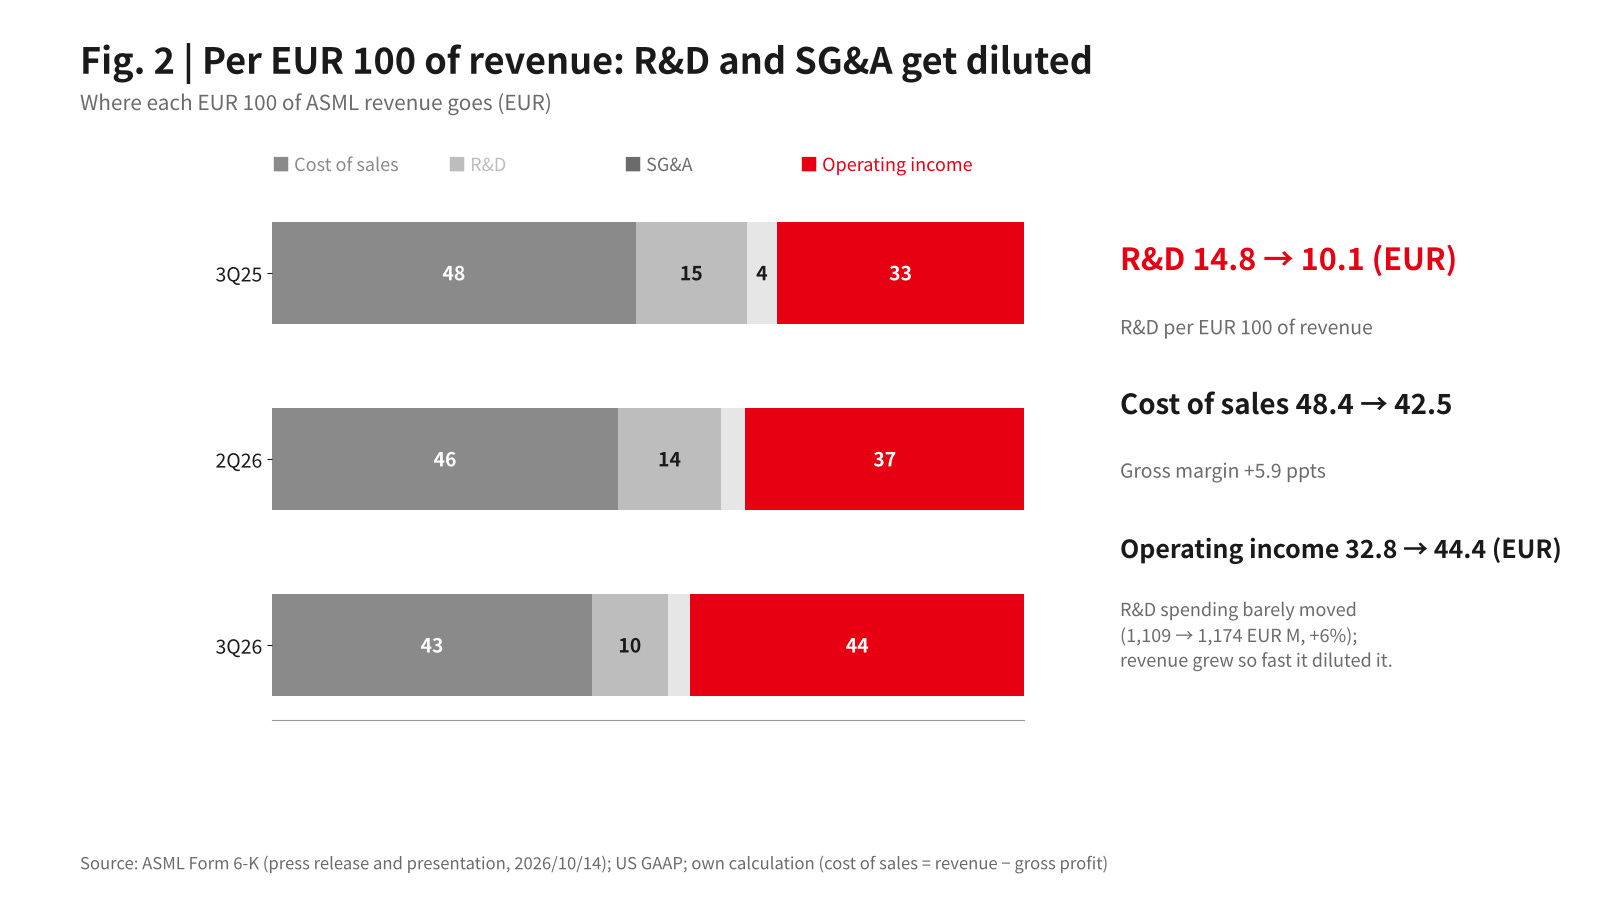
Fig. 2 | Per EUR 100 of revenue: R&D and SG&A get diluted. How to read: each bar shows where EUR 100 of revenue goes; grey is cost and expense, red is operating income. Source: ASML Form 6-K; own calculation.
2. 121 systems shipped, and services are 28% of revenue
The volume changed as well. The company shipped 121 lithography systems this quarter (113 new, 8 used), versus 72 a year earlier, which is 1.7 times as many. System sales were EUR 8.37 billion (USD 9.5 billion) and services (Installed Base Management) EUR 3.29 billion (USD 3.7 billion), the latter 28% of revenue.
One question the report does not answer: how much of the growth is price and how much is volume? Revenue is up 55% and shipments are up 68%, which at first glance looks like volume leading. But the system mix (EUV versus DUV) was not disclosed, so whether average selling prices changed cannot be seen from this report. This is to be verified.
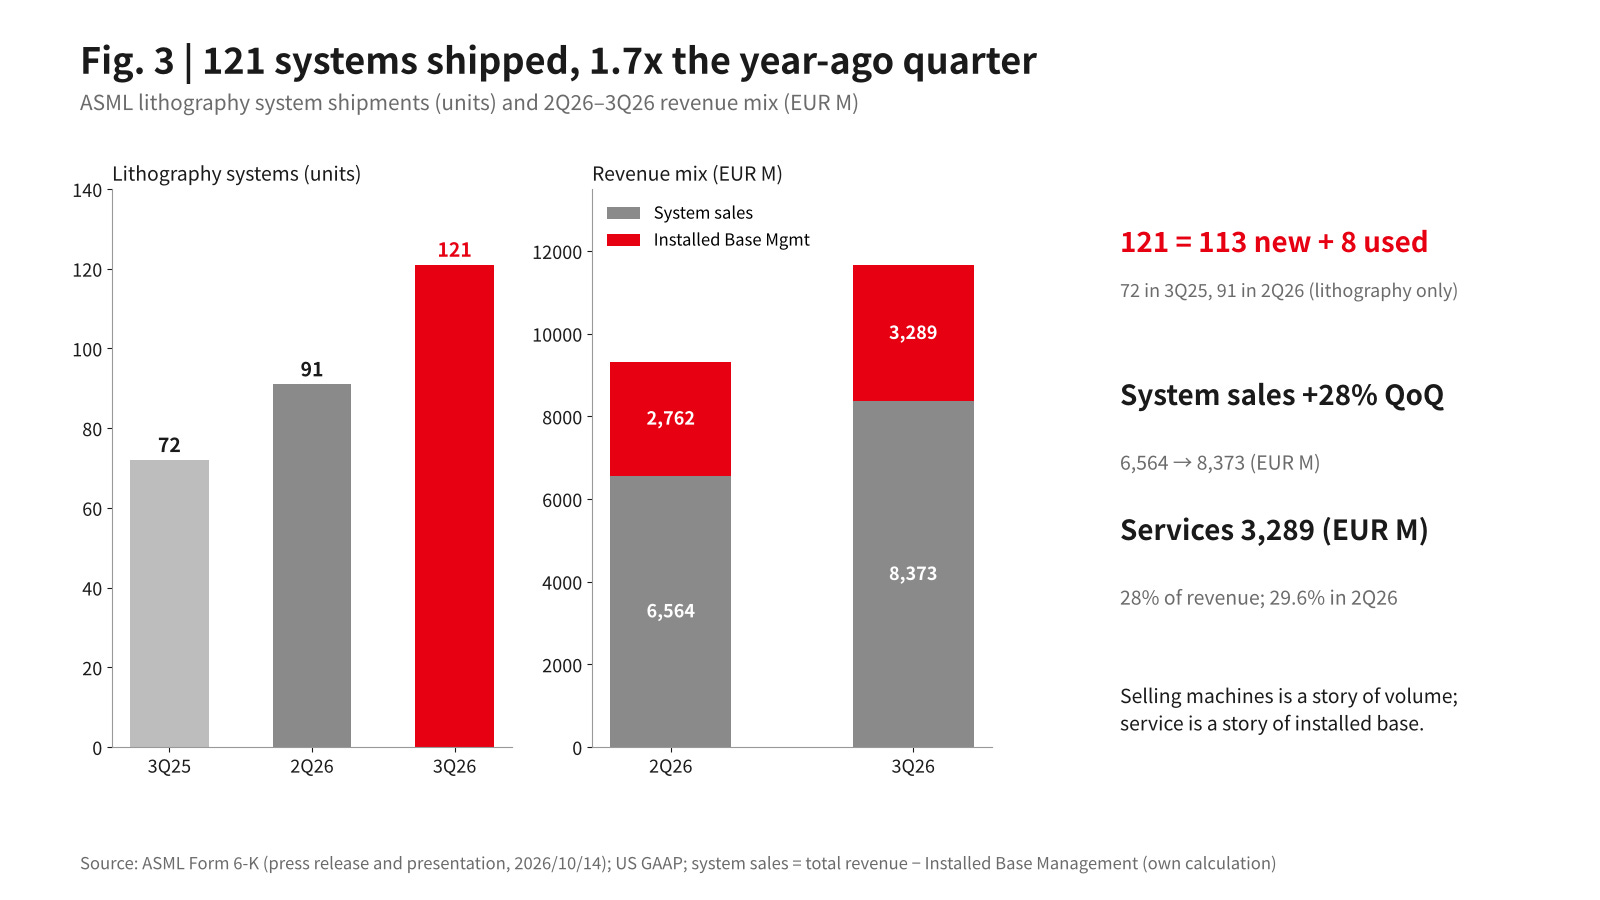
Fig. 3 | 121 systems shipped, 1.7x the year-ago quarter. How to read: the left panel shows shipments over three quarters; the right splits revenue into system sales and services (Installed Base Management). Source: ASML Form 6-K; shipments cover lithography systems only, not metrology and inspection tools.
3. Company guidance: another 26% next quarter
The company guides 4Q26 revenue to EUR 14.2–15.2 billion (USD 16.0–17.2 billion), whose midpoint is about 26% above 3Q26, with gross margin around 57%, R&D around EUR 1.2 billion and SG&A around EUR 0.4 billion. For full-year 2026 it expects revenue of EUR 44.0–45.0 billion (USD 49.7–50.8 billion), gross margin around 56% and a tax rate around 17%. This is company guidance, not my forecast.
For 2027 the company gave no financial guidance, only commentary on supply and capacity; the next Investor Day is set for June 10, 2027.
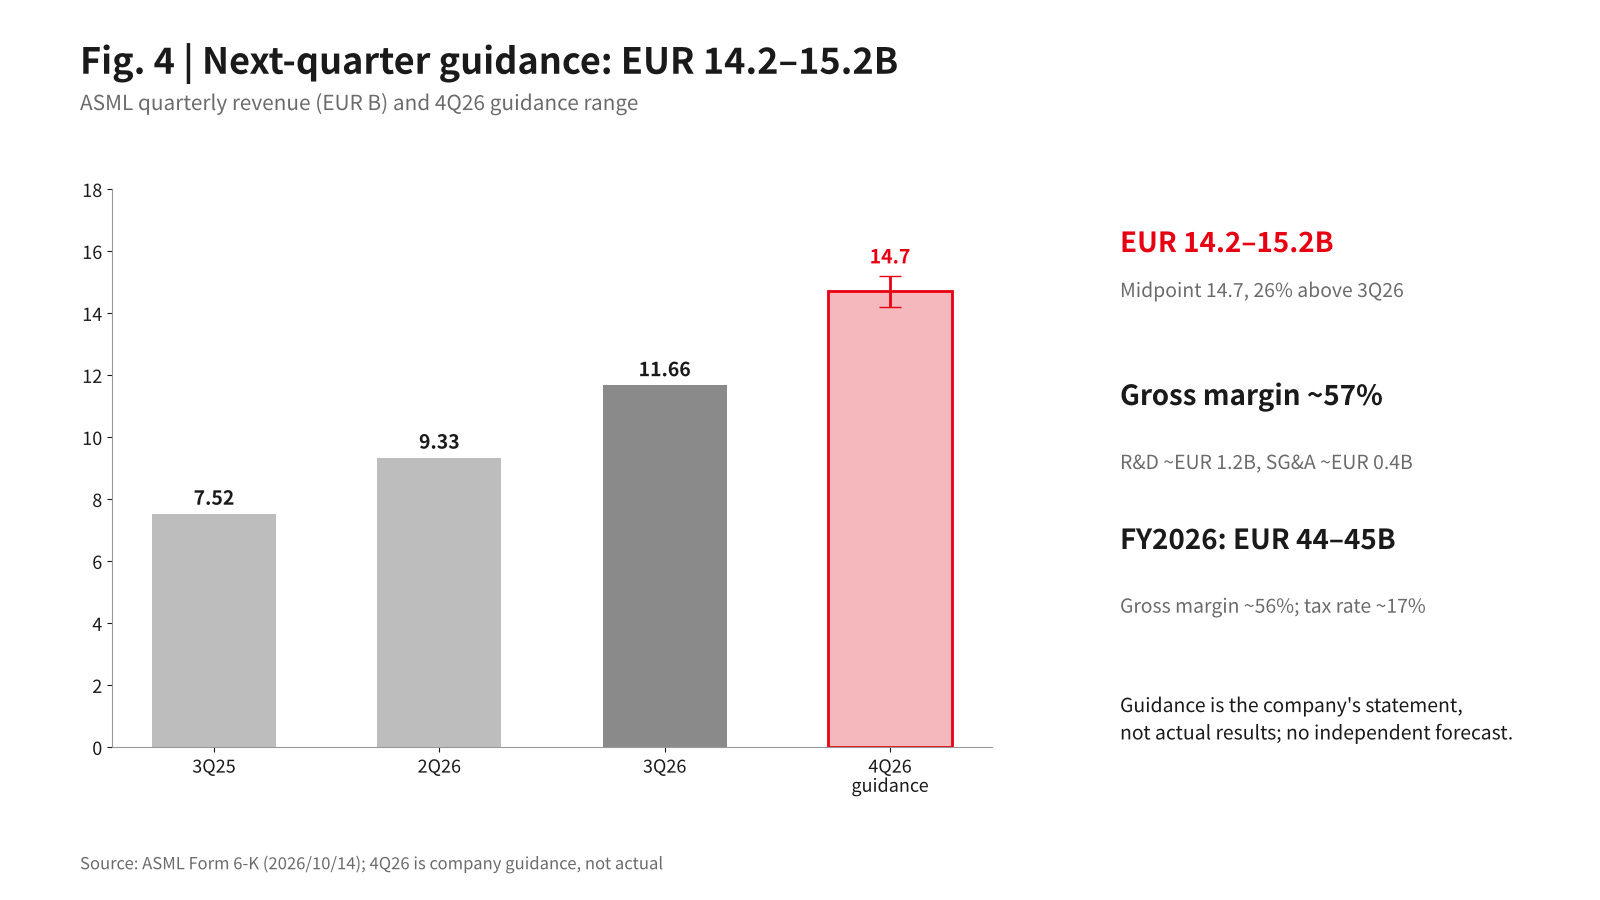
Fig. 4 | Company guidance: 4Q26 revenue of EUR 14.2–15.2 billion. How to read: grey bars are quarters already reported (3Q25, 2Q26, 3Q26) and the pink bar is the 4Q26 guidance range, with error bars at the ends of the range. Source: ASML Form 6-K (2026/10/14).
4. Cash: free cash flow of EUR 11.35 billion
Free cash flow this quarter was EUR 11.35 billion (USD 12.8 billion), versus just EUR 0.24 billion (USD 0.27 billion) a year earlier. Cash and short-term investments stood at EUR 12.74 billion (USD 14.4 billion), EUR 5.15 billion (USD 5.8 billion) more than the previous quarter. The company bought back about EUR 4.10 billion (USD 4.6 billion) of shares in the quarter, and a dividend of EUR 1.88 per share is payable on November 4. Inventory was EUR 11.90 billion (USD 13.4 billion).
Whether the build-up in inventory means the company is stockpiling for future shipments is not stated in the report; I treat it as an inference to be verified, not a conclusion. What is more certain: this quarter’s free cash flow was more than 47 times the year-ago level, yet the company still says capacity is short. Cash in hand, orders in hand, and still unable to build enough. That points to a supply constraint, not weak demand.
5. The five-year cycle: revenue +76%, and +36% again this year
Zooming out, FY21 revenue was EUR 18.6 billion and FY25 was EUR 32.7 billion, an increase of 76%; the midpoint of FY26 guidance, EUR 44.5 billion, implies roughly another 36%. Net margin ranged from 27% to 32% between FY21 and FY25; the 3Q26 quarterly net margin was 42.5% (own calculation), well above the five-year range.
R&D expense rose from EUR 2.5 billion in FY21 to EUR 4.7 billion in FY25, 1.8 times as much, and stayed at 14%–15% of revenue. In 3Q26, R&D was only 10.1% of revenue. R&D got bigger yet looks smaller: that is the denominator growing, not R&D being cut.
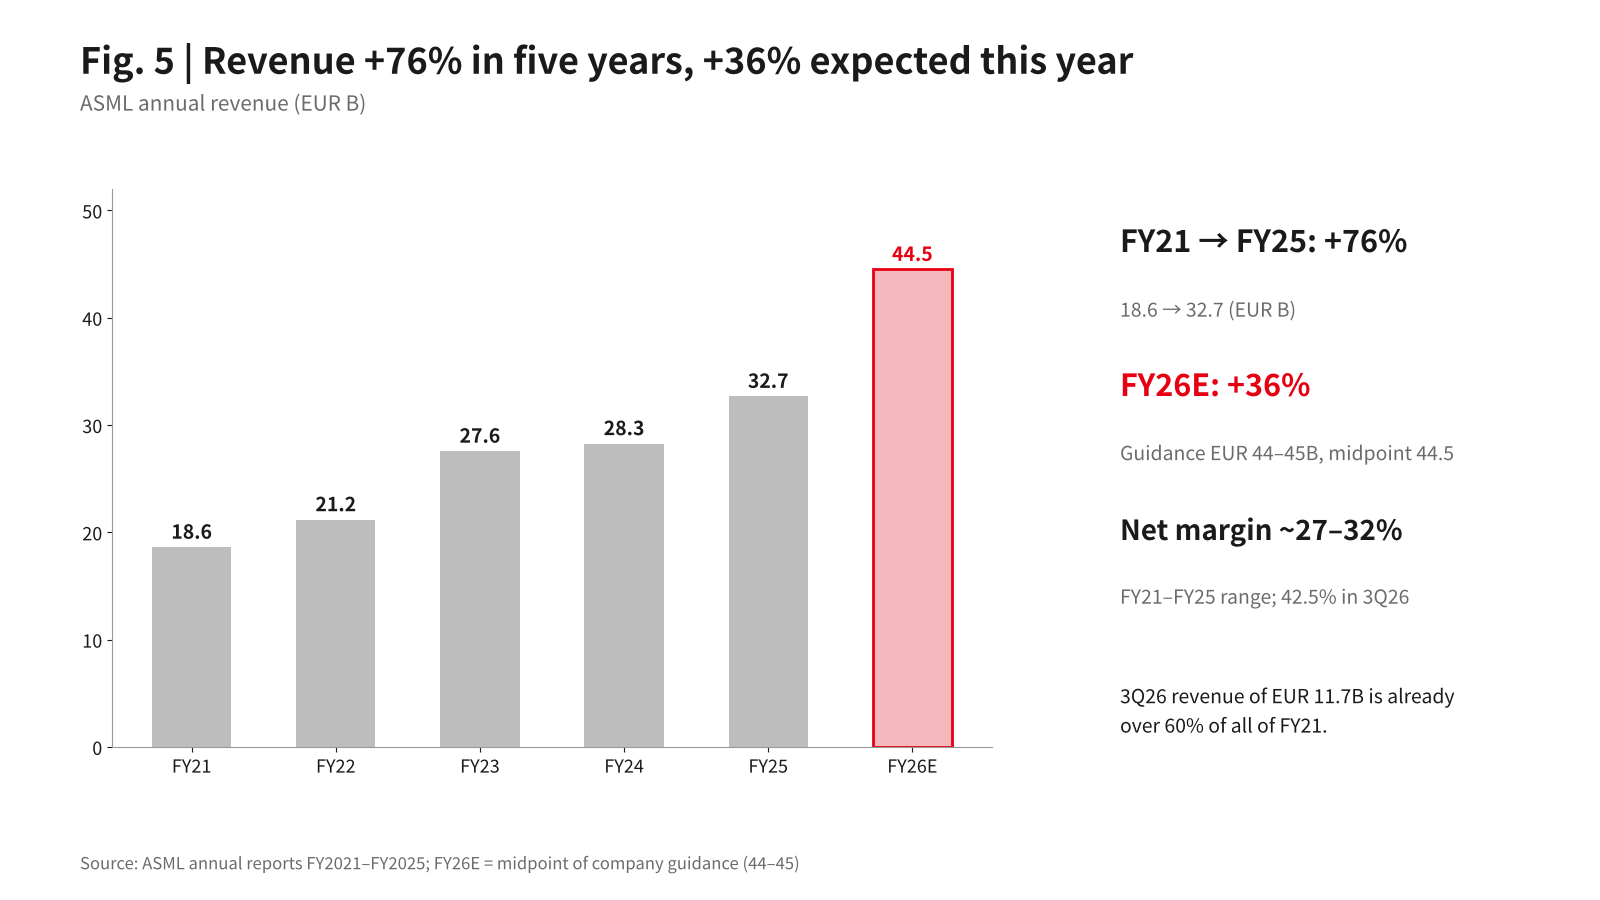
Fig. 5 | Revenue +76% in five years, +36% expected this year. How to read: grey bars are FY21–FY25 annual revenue; the pink bar is the midpoint of company guidance for FY26, not actual results. Source: ASML annual reports FY2021–FY2025; FY26E is company full-year guidance.
6. Three economic concepts
First, monopoly rent. EUV lithography has a single supplier, which is industry consensus and not a figure from this report. The part of price above cost comes from having no substitute. A 57.5% gross margin is what that rent looks like, but the report discloses neither customers nor unit prices, so how large the rent is cannot be measured directly.
Second, rationing by queue. When demand exceeds supply, markets need not clear through higher prices; they can clear through queues. The company says some customers already want to place orders for 2029–2030. Time becomes a substitute for price, and an order becomes an option. That too is the company’s statement, which I have not independently verified, and this quarter’s press release gives no net bookings figure.
Third, principal–agent problems and information asymmetry. Customers know their own expansion plans better than anyone; ASML knows its own capacity limits better than anyone. Each side’s order and lead-time information is opaque to the other. Who overstates demand to grab capacity, and who understates capacity to keep the queue going, outsiders can only see in the results.
7. Three things to watch
First, whether guidance is met. 4Q26 revenue of EUR 14.2–15.2 billion and gross margin around 57% is the next test the company has set for the market; only a result above the midpoint would count as a surprise.
Second, 2028 capacity. The company is studying whether 2028 capacity can exceed the +30% it previously announced. Expand too slowly and orders queue until 2030; expand too fast and you meet the old problem of the cobweb model: everyone expands at once, and prices fall when the supply arrives.
Third, what the cash is used for. A quarter of EUR 11.35 billion in free cash flow and about EUR 4.1 billion in buybacks: the balance between buybacks and expansion is the company’s real view of the cycle.
One earnings report, one machine the world cannot get enough of. A seller’s market is seductive, but the people in the queue will eventually find a way to build one themselves.
Note: This article is industry observation, not investment advice. Quarterly figures are from ASML’s Form 6-K (3Q26 press release and presentation, 2026/10/14; US GAAP, EUR millions); annual figures are from ASML’s annual reports FY2021–FY2025. USD figures are converted at this study’s fixed rate of USD 1 = EUR 0.885 (own calculation). To be verified: 3Q capex, net bookings and backlog, EUV/DUV, logic/memory and regional splits (none provided in the 6-K); the purpose of the inventory build is an inference; “sole EUV supplier” is industry consensus. Market capitalization is my own estimate from the mid-October closing price and shares outstanding, not a company-reported figure.
Sources:
ASML Holding N.V., Form 6-K (SEC, 2026/10/14): 3Q26 press release and presentation
ASML annual reports FY2021–FY2025 (company IR)
ASML investor relations, share information (major shareholders as of 2026/2/18; shares outstanding)